US Dollar Bearish Momentum after Failing to Break Resistance
EUR/USD
4 hour

The EUR/USD was unable to break below the critical support level (blue) and instead bounced strongly to the upside. The bounce indicates that an expansion within wave 2 (brown) is most likely.
1 hour
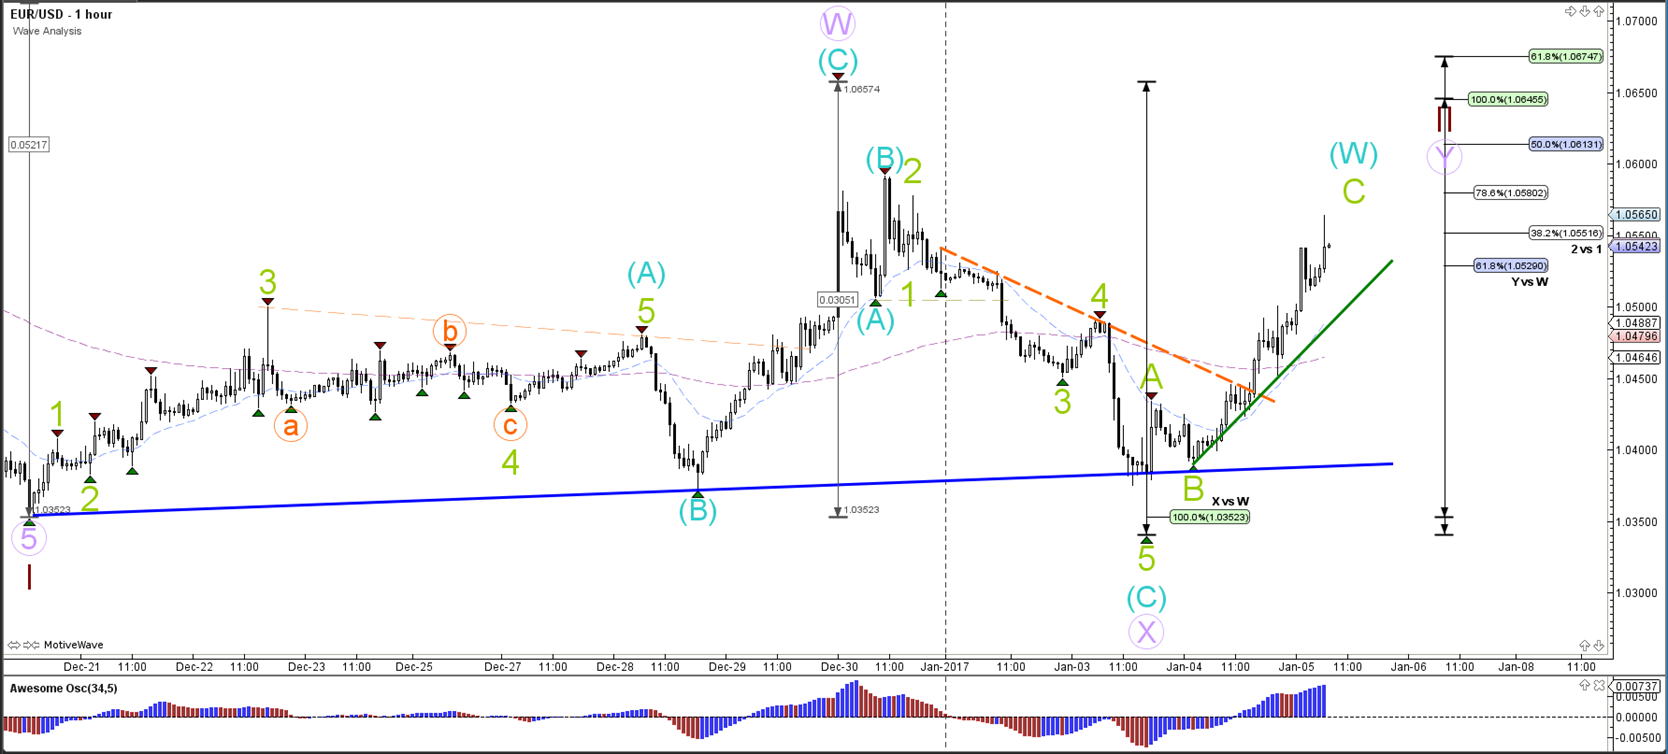
The EUR/USD break above the resistance trend line (dotted orange) changed the wave count to the current form because a larger bullish correction became more likely. The EUR/USD could expand the correction (wave W blue) unless price breaks below the main support (blue).
GBP/USD
4 hour
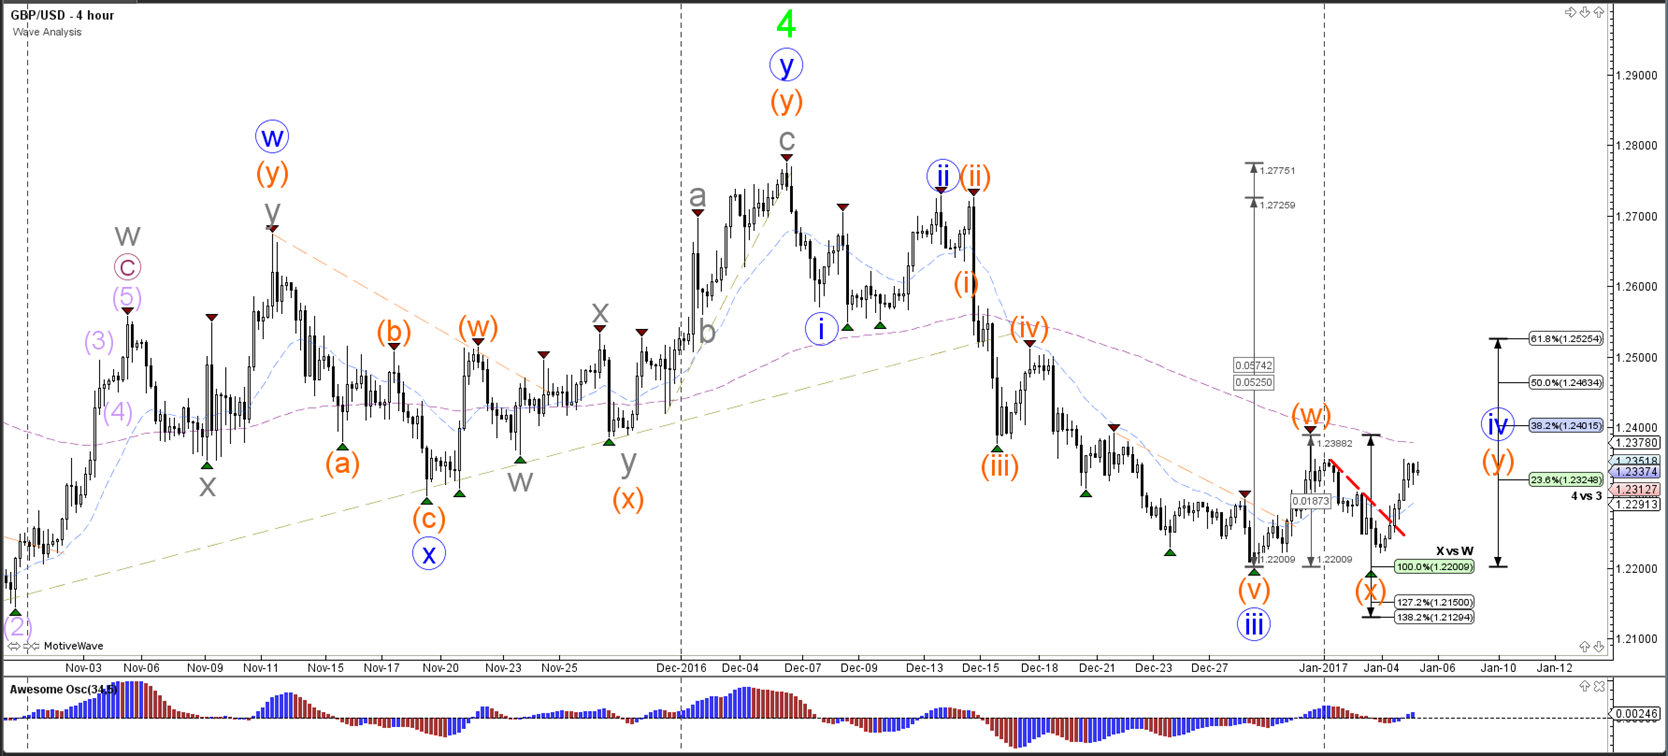
The GBP/USD broke the resistance trend line (dotted red) and is building a larger retracement within a wave 4 (blue) correction. A wave 4 (blue) typically retraces back to the 23.6-38.2-50% Fibonacci levels.
1 hour
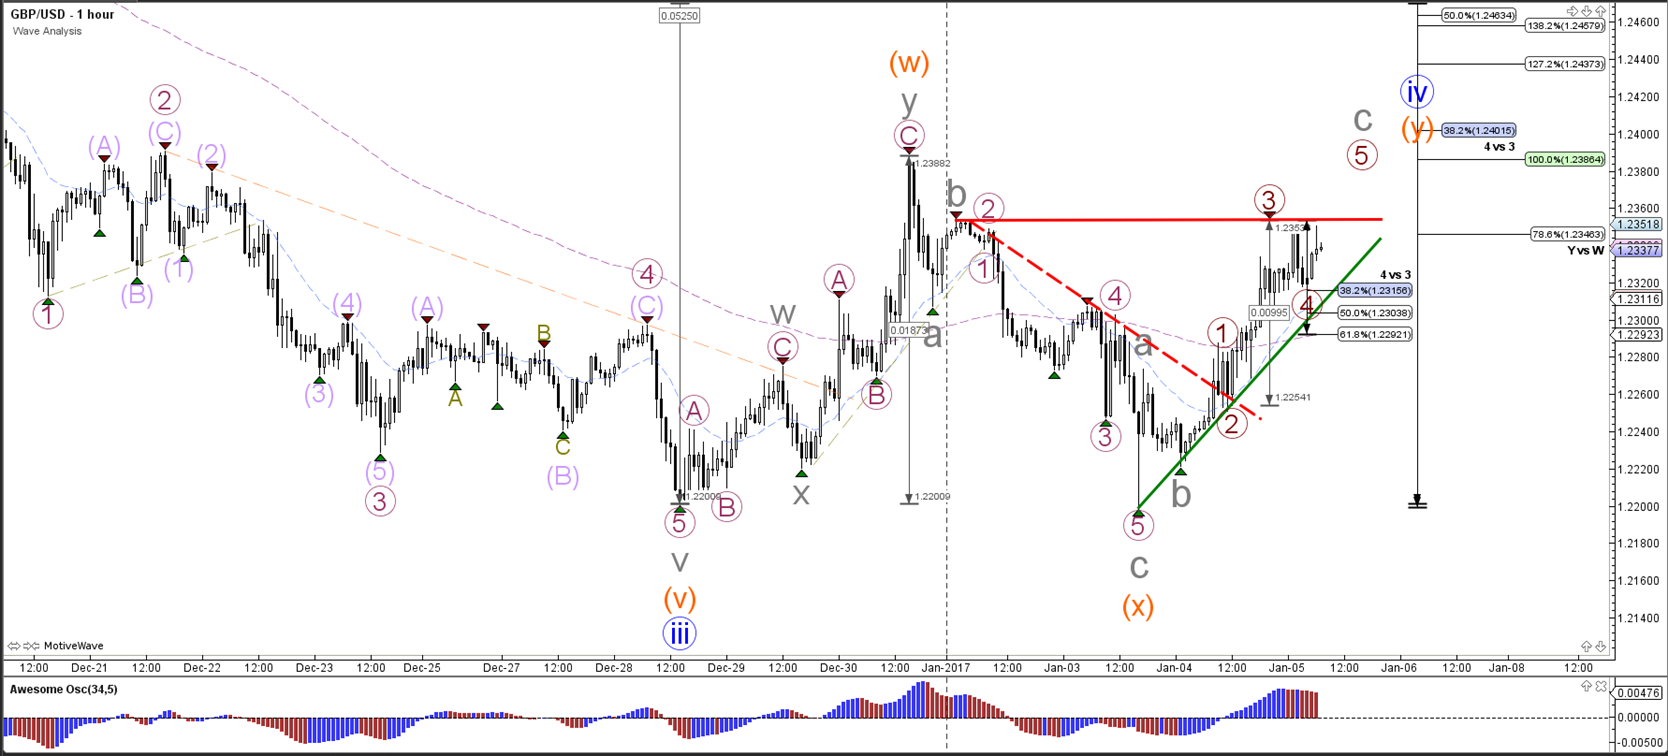
The GBP/USD broke above resistance (dotted red) and extended the ABC (grey) within wave Y (orange). Price is in a wave 4 (dark red) unless a break out occurs below the 61.88% Fibonacci level. A break above the resistance (red) could see price complete a wave 5 (dark red).
USD/JPY
4 hour
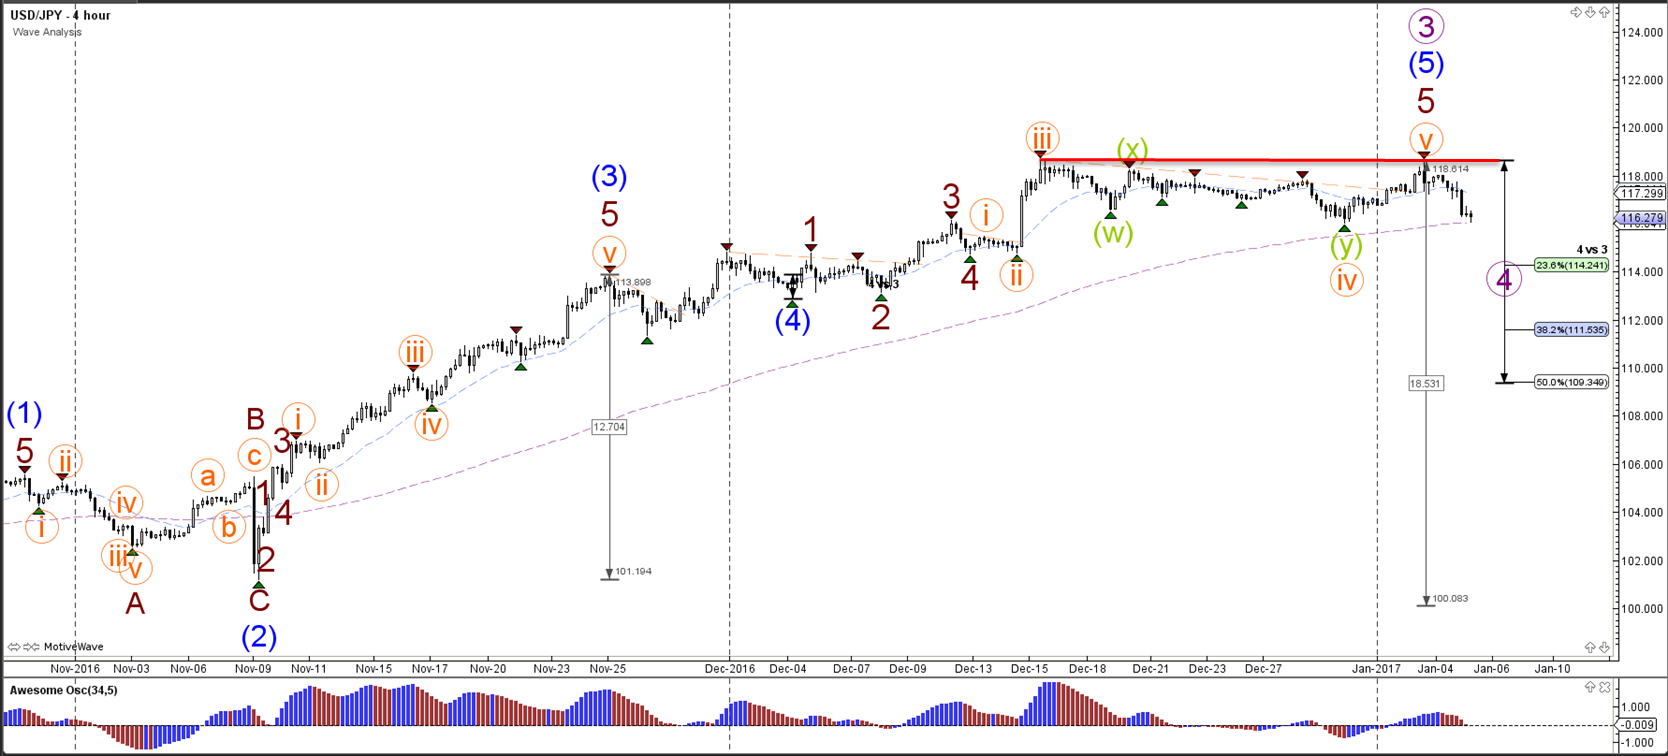
The USD/JPY broke above the resistance trend line (dotted orange) but did not manage to break above the previous top (red). The bearish turn around could indicate a completion of wave 5 (orange) and also wave 3 (purple) and the start of a wave 4 (purple) correction.
1 hour
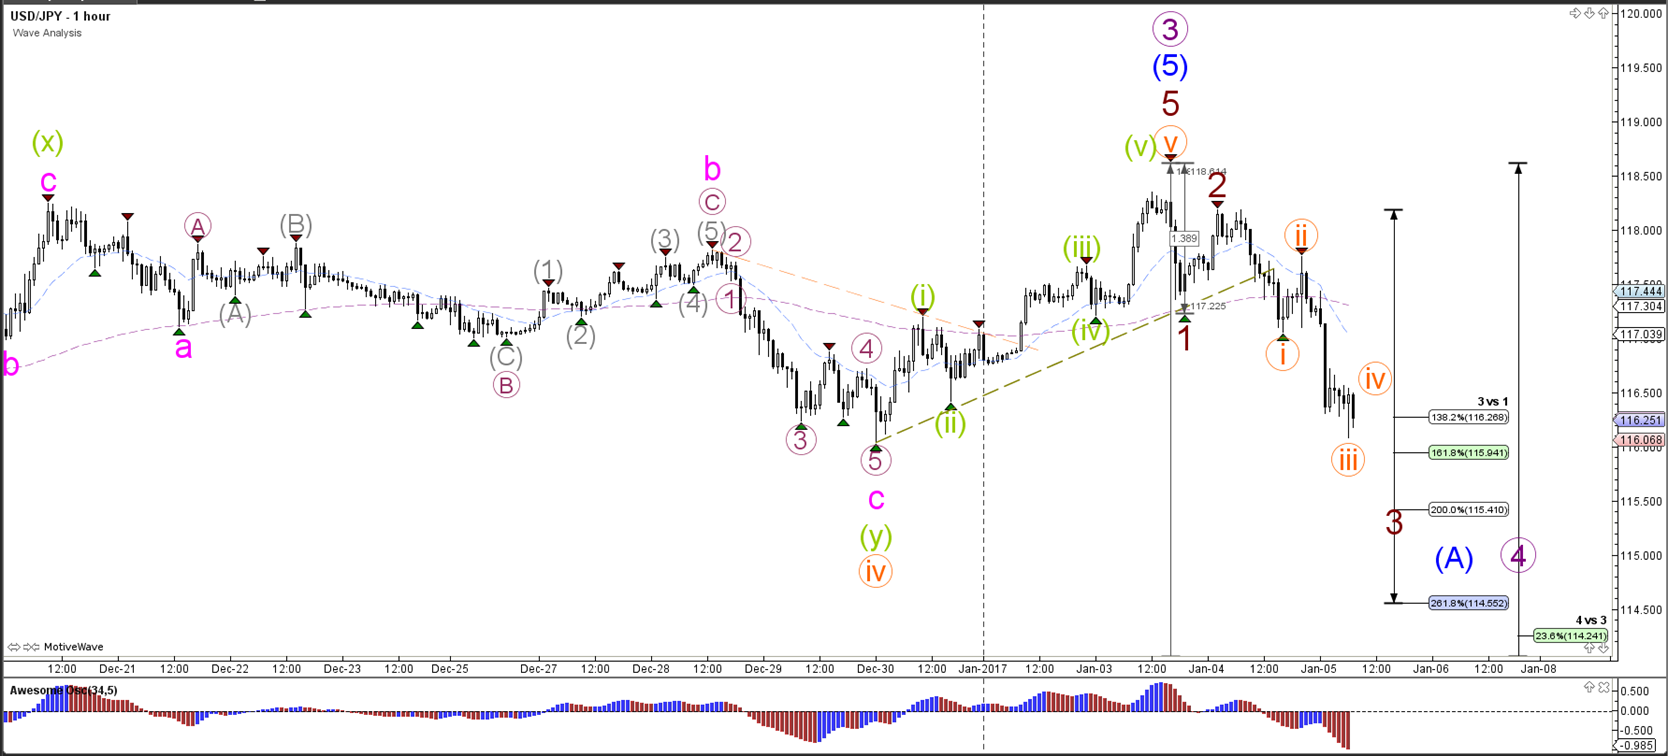
The USD/JPY is most likely building a bearish 5 wave pattern within wave A (blue) of wave 4 (purple).
Follow @ChrisSvorcik on twitter for latest market updates