Forex Chart Patterns Identify Bounce and Break Zones
USD/JPY
4 hour
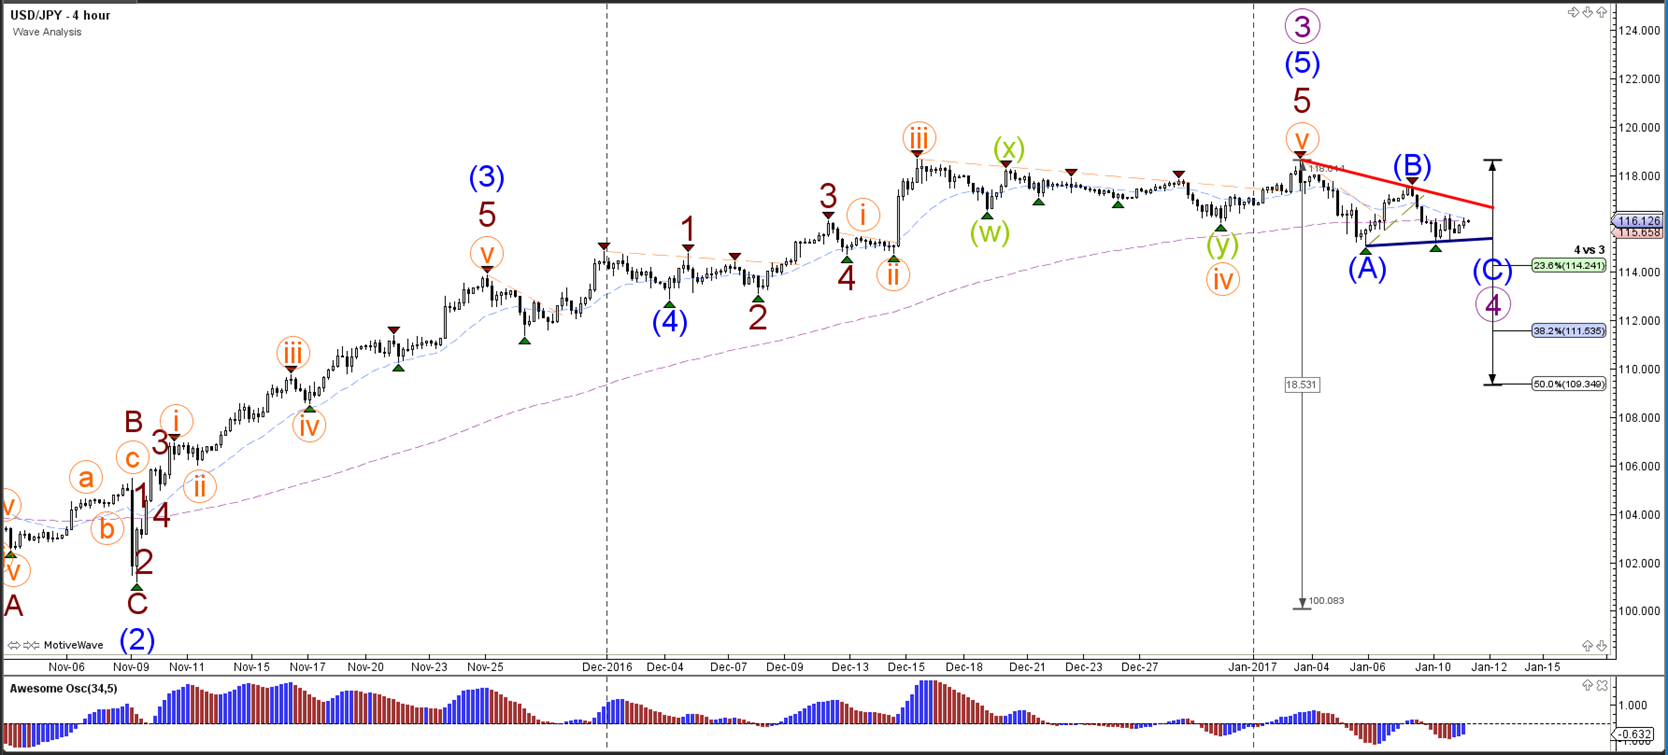
The USD/JPY is in an ABC (blue) correction within wave 4 (purple). The wave C (blue) and wave 4 (purple) will either be completed at lower Fibonacci levels of wave 4 vs 3 or once price breaks above the resistance trend line (red).
1 hour

The USD/JPY could be in a wave 4 (brown) unless price breaks above the 61.8% Fibonacci level which makes it more likely that a wave 5 (brown) was completed at the previous bottom.
EUR/USD
4 hour
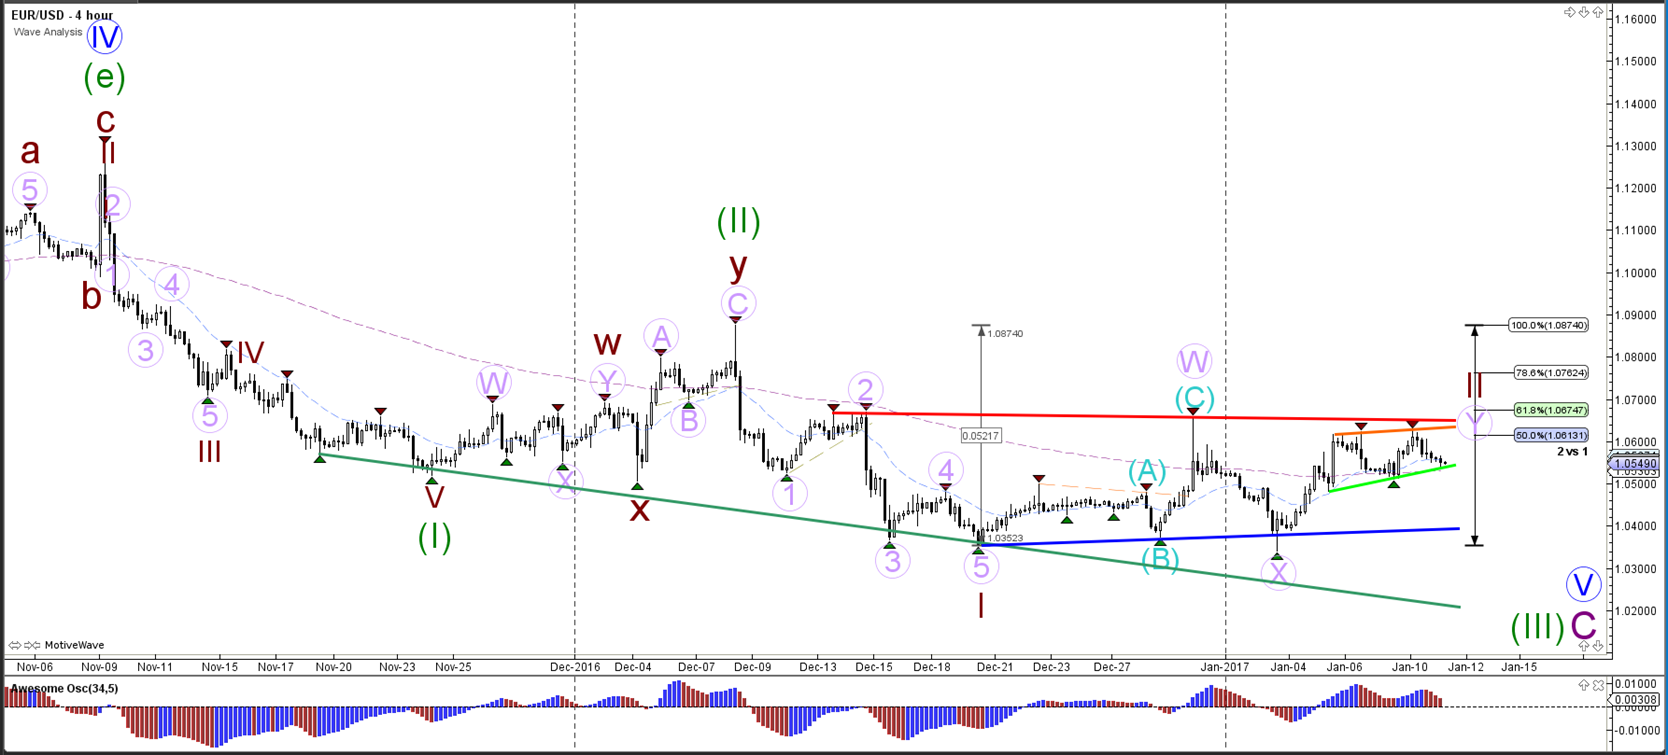
The EUR/USD continues to respect the support (green) and resistance (orange) levels as the currency pair remains in the consolidation zone. The wave 2 (brown) is invalidated if price breaks above the 100% Fibonacci level of wave 2 vs 1. Price could make a bearish turn at the 61.8% or 78.6% Fib if price breaks above resistance (orange/red). A break below support (green) could see price challenge the next support trend lines.
1 hour
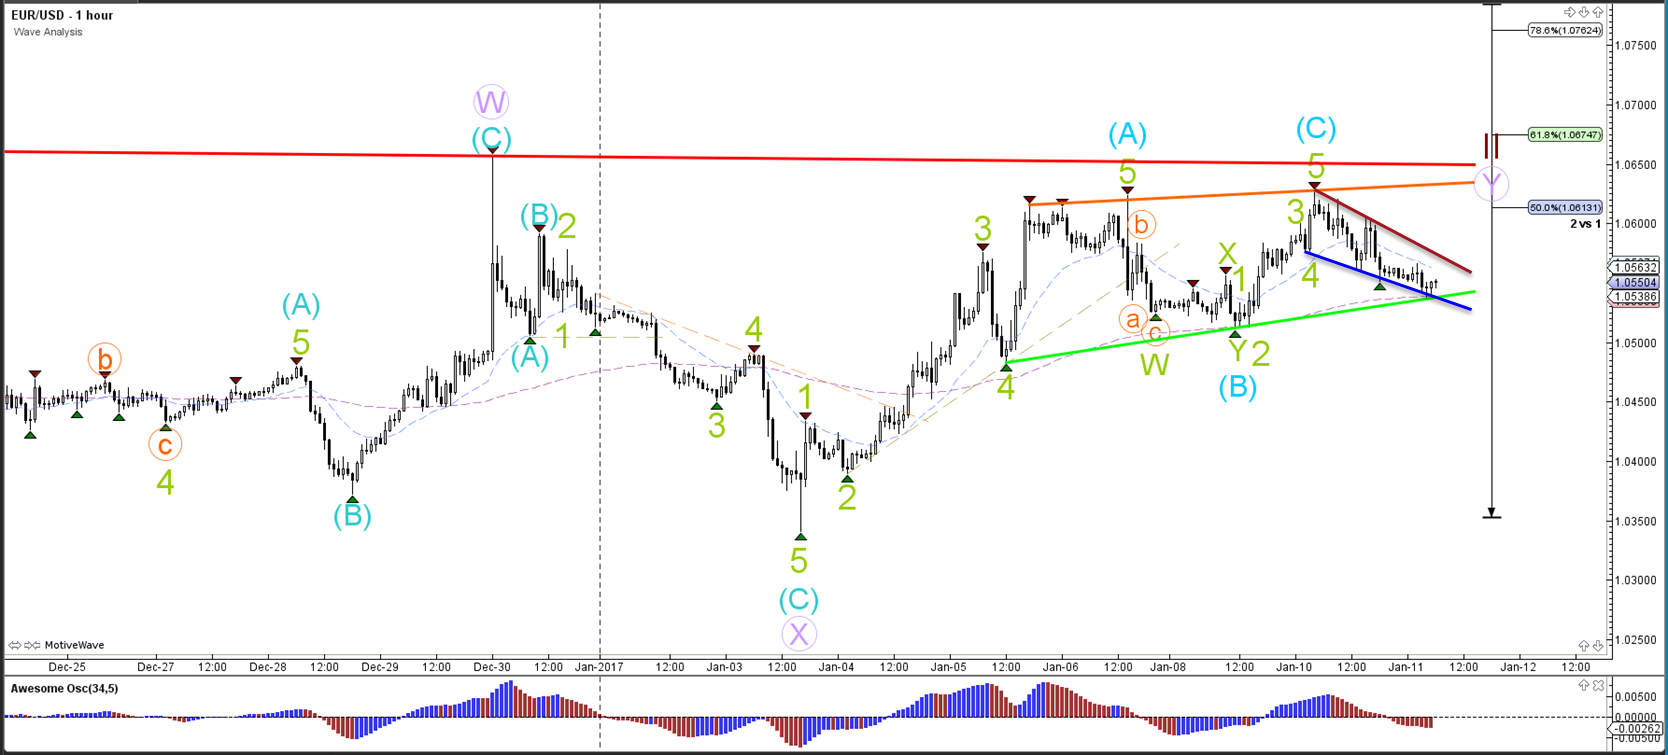
The EUR/USD needs to break below the support trend lines (green/blue) before the completion of wave C (blue), Y (purple) and 2 (brown) can be confirmed. Otherwise the bearish price action could be part of a retracement with potentially more upside remaining to test the Fib levels of wave 2. At the moment price is building a corrective bearish channel (brown/blue lines).
GBP/USD
4 hour

The GBP/USD retraced back to the broken support level (dotted green) which could be a resistance spot. Price needs to break below the previous low (blue line) before it can test the previous bottom (green).
1 hour

The GBP/USD is still showing a corrective chart pattern which is typical for a wave 4 (brown). The current wave 4 (brown) is invalidated if price breaks above the 61.8% Fibonacci retracement level of wave 4 vs 3. Price could continue with the downtrend (red arrows) if price manages to break below the support trend lines (green) with a strong breakout candle.
Follow @ChrisSvorcik on twitter for latest market updates
